UV spectroscopic method for simultaneous estimation of Celecoxib and
Amlodipine
Devanshi S Pathak, Prasanna K Pradhan*, Dhananjay B Meshram, Hiral A
Patel
Department of Quality Assurance, Pioneer Pharmacy Degree College,
Vadodara, Gujarat, India
*Correspondence
: prasanna.k.pradhan@gmail.com
Abstract
A simple, precise and accurate First order derivative UV spectroscopic
method has been developed for estimation of Celecoxib (CEL) and
Amodipine (AML) simultaneously. The linearity was established over the
concentration range of 15–40
𝜇
g/mL and 3–8
𝜇
g/mL for CEL and AML respectively. The mean % recoveries were found to
be 99.78%for CEL and 100.36% for AML. The proposed method was validated
as per ICH guidelines and successfully applied for assay of CEL and AML
in their synthetic mixture.
Keywords:
Celecoxib, Amlodipine, UV-spectrophotometry
INTRODUCTION
Celecoxib (CEL) is selective COX-2 inhibitor. CEL is chemically,
4-[5-(4-Methylphenyl)-3-(trifluoromethyl) pyrazol-1-yl] benzene
sulphonamide (Fig. 1).
Fig 1: Structure of CEL
Celecoxib is believed to be prostaglandin synthesis inhibitor. Most NSAIDs
inhibit both types of cyclooxygenases (COX-1 and COX-2), celecoxib is a
selective non-competitive inhibitor of cyclooxygenase-2 (COX-2) enzyme. CEL
applied as anti-inflammatory, analgesic and antipyretic actions with low
ulcerogenic potential so indicated as to relieve the signs and symptoms of
Rheumatoid arthritis (RA) and Osteoarthritis (OA) [1-3].
Amlodipine besylate is chemically 3-Ethyl 5-methyl (4RS)-2-[(2-aminoethoxy)
methyl]-4-(2-chlorophenyl)-6-methyl-1,4-dihydropyridine-3,5- dicarboxylate
benzene sulphonate (Fig. 2). Amlodipine reduces contractility of arterial
smooth muscle and following vasoconstriction by inhibiting calcium ions
influx through L-type calcium channels. The overall decrease in blood
pressure is due to vasodilatory effects of amlodipine. Amlodipine,
long-acting CCB commonly used for management of hypertension1 and coronary
artery disease [1-3].
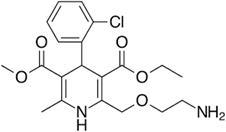
Fig 2: Structure of AML
KIT-302 (CEL and AML) is a NSAID and Calcium channel blocker drug
combination in development for both, the treatment of hypertension and pain
associated with osteoarthritis [4].
Several analytical methods for quantifying CEL has been reported; such as
UV-spectrophotometry [6,7], HPLC [8-10] and LC-MS/MS [11]. Several
analytical methods for quantifying AML have been reported; such as
UV-spectrophotometry [12,13], HPLC [14-16], UPLC [17], HPTLC [18,19] and
LC-MS/MS [20]. From the literature survey it revealed that none of the
methods were reported for simultaneous estimation of CEL and AML.
EXPERIMENTAL
A. Chemicals and Reagents
Analytically pure CEL and AML was procured as gratis samples from Prudence
Pharma Chem. Ankleshwar, Gujarat, India. Tablet of CEL and AML were
prepared synthetically in lab.
B. Instruments
A LAB-INDIA 3600+ double beam spectrophotometer with wavelength
accuracy 0.5 nm, 1cm matched quartz cells and UV-Win 5 software was used.
Calibrated analytical balance Shimadzu was used for weighing purpose. All
statistical calculations were carried out using MS-Excel-2010 analytical
tool.
C. Preparation of Sample and Solutions
1) Preparation of Tablet
Immediate release tablets of total weight 350 mg each, containing 200 mg of
CEL and 10 mg of AML were prepared.
2) Preparation of Standard Primary Stock Solutions
Accurately weighed 100 mg of CEL and AML standard was transferred to a
separate 100 mL volumetric flask and dissolved in 25 mL of Methanol. The
flasks were shaken and volume was made up to the mark with Methanol having
strength of 1000 µg/mL CEL and 1000 µg/mL AML.
3) Preparation of Standard Secondary Stock Solutions
Appropriate volume of stock solution was withdrawn from primary standard
stock solution of CEL and AML to produce secondary stock solution having
strength of 500 µg/mL and 100 µg/mL of CEL and AML respectively.
D. Selection of Analytical Wavelength
Appropriate volume of aliquot from CEL and AML secondary standard stock
solution was transferred to volumetric flask of 10mL capacity. The volume
was adjusted to the mark with Methanol to give working standard solutions
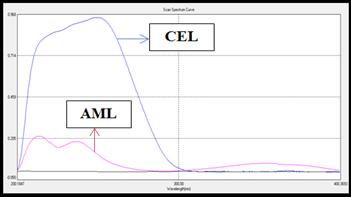
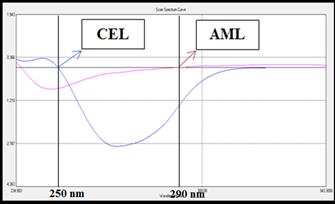
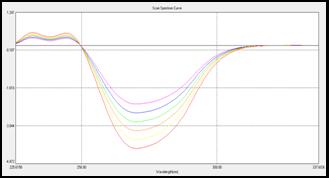
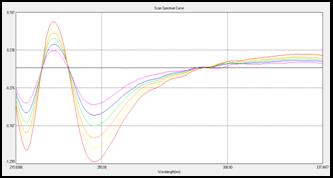
containing 25𝜇g/mL of CEL and 5 𝜇g/mL of AML respectively. The spectrum was
recorded between 200-400 nm and all the zero-order spectrum (D0)
(Fig 3a) were converted to first derivative spectrum (D1) using
co-efficient value 100 and no. of points 21. The overlain 1st
derivative spectrums of CEL and AML was recorded. The zero-crossing point
(ZCP) of CEL was found to be 250 nm and ZCP of AML was found to be 290 nm
(Fig 3b).
Similarly, all test concentration of CEL (15-40 µg/mL) and AML (3-8 µg/mL)
were prepared and scanned in the range of 200-400 nm and converted to D 1 spectra. The optimized condition for the method validation was
mentioned in Table 1.
Table 1: Optimised conditions
|
Parameters
|
Optimized conditions
|
|
Solvent
|
Methanol
|
|
Slit width
|
0.5 nm
|
|
No. of points
|
21
|
|
Co-efficient value
|
100
|
|
Range for CEL
|
15-40 µg/mL
|
|
Range of AML
|
3-8 µg/mL
|
|
ZCP of CEL
|
250 nm
|
|
ZCP of AML
|
290 nm
|
(a)
(b)
Fig 3: (a) Overlain D0 spectra of CEL (25 µg/mL) and AML (5 µg/mL)
(b) Overlain D1 spectra CEL (25 µg/mL) and AML (5 µg/mL)
RESULTS AND DISCUSSION
A. Method Validation
[5]
The proposed method was validated in terms terms of linearity, accuracy,
precision, limits of detection (LOD) and quantification (LOQ). The accuracy
was expressed in terms of percent recovery of the known amount of the
standard drugs added to the known amount of the synthetic formulation. The
precision (% relative standard deviation—% RSD) was expressed with respect
to the repeatability, intraday, and interday variation in the expected drug
concentrations. After validation, the developed methods have been applied
to synthetic dosage form.
1) Linearity
CEL and AML showed linearity in the range of 15-40 µg/mL and 3-8 µg/mL,
respectively. Linear regression equation and correlation coefficient (R2) are: YCEL= -0.0386x – 0.7068 (R2 = 0.9992) and YAML = -0.1467x – 0.0316 (R 2= 0.9991) (Table 2, Figure 4 and 5).
Table 2: Statistical data of CEL and AML
|
Parameters
|
CEL
|
AML
|
|
Linear range
|
15-40 µg/mL
|
3-8 µg/mL
|
|
Slope
|
0.0386
|
0.1467
|
|
Intercept
|
0.7068
|
0.0316
|
|
SD of intercept
|
0.00273
|
0.00697
|
|
Regression co-efficient (R2)
|
0.9992
|
0.9991
|
(a)
(b)
Fig4: Calibration curve of (a) CEL at 290 nm and (b) AML at 250 nm


(a)


(b)
Fig 5: Overlain D1 spectra of (a) CEL (15-40 µg/mL) and (b) AML
(3-8 µg/mL) in Methanol
2) Precision
The precision of the method was checked by Repeatability and Intermediate
precision (Intraday and Interday). The Relative Standard Deviations
(R.S.D.) for CEL and AML were found to be within the acceptable limit i.e.
2%. (Table 3,4 and 5)
Table 3: Repeatability of CEL and AML
|
Concentration (µg/mL)
|
Mean (ABS) ± SD (n=6)
|
% RSD
|
|
|
CEL
|
AML
ZCP of CEL
at 250 nm
|
CEL
|
AML
|
CEL
|
AML
|
|
|
30
|
6
|
-1.870 ± 0.0075
|
-0.909 ± 0.0018
|
0.40
|
0.20
|
|
|
|
|
|
|
Table 4: Intraday Precision of CEL and AML
|
Drug
|
Conc. (µg/mL)
|
Mean (ABS) ± SD (n=3)
|
% RSD
|
|
CEL
|
15
|
-1.293 ± 0.0076
|
0.59
|
|
30
|
-1.872 ± 0.0091
|
0.48
|
|
40
|
-2.246 ± 0.0074
|
0.33
|
|
AML
|
3
|
-0.478 ± 0.0040
|
0.84
|
|
6
|
-0.908 ± 0.0066
|
0.72
|
|
8
|
-1.218 ± 0.0025
|
0.21
|
Table 5: Interday Precision of CEL and AML
|
Drug
|
Conc. (µg/mL)
|
Mean (ABS) ± SD (n=3)
|
% RSD
|
|
CEL
|
15
|
-1.293 ± 0.013
|
1.00
|
|
30
|
-1.869 ± 0.008
|
0.43
|
|
40
|
-2.248 ± 0.007
|
0.31
|
|
AML
|
3
|
-0.476 ± 0.005
|
1.05
|
|
6
|
-0.901 ± 0.010
|
1.11
|
|
8
|
-1.215 ± 0.004
|
0.33
|
3) Accuracy
Accuracy of the method is to check the closeness of the true value with the
obtained result. Accuracy of the method was performed by standard addition
method. The recovery study was performed by calculating the spiked
concentration of standards at 80 %, 100 % and 120 % of CEL and AML to
pre-analyzed mixture containing CEL and AML. The experiment was performed
in triplicates. The result was evaluated in terms of % Recovery, which are
well within the acceptable limit of 98-102 %. The results of the accuracy
studies are summarized in Table 6.
Table 6: Recovery study of CEL and AML
|
Drug
|
Level
(%)
|
Amt. taken (total) (µg/mL)
|
Amt. added
(µg/mL)
|
Amt. recovered (µg/mL)
|
%Recovery ± SD
|
|
CEL
|
80
|
27
|
12
|
11.92
|
99.43 ± 0.76
|
|
100
|
30
|
15
|
14.89
|
99.32 ± 0.78
|
|
120
|
33
|
18
|
18.10
|
100.59 ± 0.84
|
|
AML
|
80
|
5.4
|
2.4
|
2.415
|
100.67 ± 0.57
|
|
100
|
6
|
3
|
2.976
|
99.24 ± 0.47
|
|
120
|
6.6
|
3.6
|
3.642
|
101.19 ± 0.56
|
4) Detection Limit and Quantitation Limit
In the present study, the LOD and LOQ were based on standard deviation of
the response and the slope of the calibration curve and were calculated
according to the 3.3𝜎/S and 10 𝜎/S criterions, respectively, where 𝜎 is the
standard deviation of the 𝑦-intercepts of the regression lines and 𝑆 is the
slope of the calibration curve. (Table 7)
Table 7: LOD and LOQ of CEL and AML
|
Parameters
|
CEL
|
AML
|
|
LOD
|
0.686
|
0.156
|
|
LOQ
|
2.080
|
0.475
|
5) Determination of CEL and AML in their combined synthetic tablet
dosage form (Assay)
20 Tablets were (Prepared in Lab scale with a Label Claim of 200 mg CEL and
10 mg AML) weighed and triturated. Powder Equivalent to 100mg CEL and 5mg
AML (i.e. 175.5 mg) was weighed accurately and transferred to 100
mL volumetric flask. 25 mL methanol was transferred to volumetric flask and
sonicated for 10 minutes. Volume was made up to mark with methanol after
addition of 15 mg of standard AML powder. This solution was used as 1 0 stock solution (1000 µg/mL of CEL and 200 µg/mL of AML).
Appropriate volume was pipetted out accurately from 10 stock
solution, and was diluted up to 10 mL with Methanol, to produce 2 0 stock solution (300 µg/mL solution of CEL and 60 µg/mL
solution of AML). Appropriate volume was pipetted out from above stock
solution and diluted with methanol up to 10 mL to prepare test
concentration (30 µg/mL solution for CEL and 6 µg/mL solution for AML). The
test solution was scanned in range of 200-400 nm to obtain the zero-order
spectrum. Which was later on transformed to D1 spectra and the
absorbance were measured at respective wavelengths as per the developed
method i.e. 250 nm & 290 nm for AML & CEL respectively.
From the recorded absorbencies, concentrations were found out and %purity
was calculated for both CEL and AML. (Table 8)
Table 8: Assay results of synthetic formulation
|
Drug
|
Labelled claim (mg)
|
Amount found per tablet (mg)
|
% Label Claim ± SD
|
|
CEL
|
200
|
198.58
|
99.29 ± 0.35
|
|
AML
|
10
|
9.93
|
99.33 ± 0.39
|
CONCLUSION
The proposed first-order derivative method was found to be simple,
specific, precise, and accurate for quantitative estimation of CEL and AML
simultaneously in their combined synthetic tablet dosage form. The method
was validated as per ICH guidelines and the validation result substantiates
that the proposed method can be useful for routine analysis and quality
control assay of CEL and AML in their synthetic mixture.
ACKNOWLEDGMENTS
The authors are thankful to Prudence Pharma Chem (Ankleshwar, India) for
providing gratis sample of both drugs. The authors are also heartily
thankful to Pioneer Pharmacy Degree College for providing the necessary
facilities for the research work.
REFERENCES
[1] H. Mohan, Textbook of Pathology, 5thed, Jaypee
Brothers Medical Publishers, New Delhi, 875-876,2005.
[2] R. Walker, C. Whittlesea, Clinical Pharmacy and Therapeutics,
4thed, Elsevier, 770-773, 2007.
[3] K.D. Tripathi, Essentials of Medical pharmacolog, 7 thed, Jaypee Brothers Medical Publishers: New Delhi, 2013.
[4] KIT REF
[5] The International Conference on Harmonization (ICH), Validation of
Analytical Procedure: Text and Methodology, Q2 (R1), Geneva, 2005.
[6] N. Patel, V. Nandurbarkar, A. Patel, S. Patel, Simultaneous
spectrophotometric determination of celecoxib and diacerein in bulk and
capsule by adsorption correction method and chemometric methods, Spectrochim. Acta Part A: Biomol. Spectrosc. 125 (2014) 46-52
[7] R. Saha, C. Sanjeev, P. Jhadhav, S. Patil, N. Srinivasan, Determination
of celecoxib in pharmaceutical formulations using UV spectrophotometry and
liquid chromatography, J. Pharm. Biomed. Anal. 28 (2002) 741-751
[8] M. Zhang, G. Moore, S. Gardiner, E. Begg, Determination of celecoxib in
human plasma and breast milk by high-performance liquid chromatoghraphy
assay, J. Chromatogr. B.,830 (2006) 245-248
[9] H. Chow, N. Anavy, D. Salazar, D. Frank, D. Alberts, Determination of
celecoxib in human plasma using solid-phase extraction and high performance
liquid chromatography, J. Pharm. Biomed. Anal., 34 (2004) 167-174
[10]F. Schonberger, G. Heinkele, T. Murdter, S. Brenner, U. Klotz, Simple
and sensitive method for the determination of celecoxib in human serum by
high performance liquid chromatography with fluorescence detection, J. chromatogr. B. (2002) 768
[11]A. Reddy, N. Venugopal, M. Gajulapalle, A selective and sensitive
LC-MS/MS method for the simultaneous determination of two potential
genotoxic impurities in celecoxib, J. Anal. Sci. Technol. 5 (2014)
1-8
[12]G. Nanda, K. Gangaiah, M. Bhargavi, G. Rao, M. Anitha, P. Anusha,
UV-Visible spectrophotometric estimation of amlodipine in pharmaceutical
dosage form, Intl. J. Res. Rev. Pharm. Appl. Sci. 5 (2015)
1251-1256
[13]R. Devi, S. Ramakrishna, New spectrophotometric methods for
simultaneous determination of amlodipine besylate and atorvastatin calcium
in tablet dosage forms, Int. J. Pharm. Sci. 2 (2010) 215-219
[14]A. Zarghi, S. Foroutan, A. Shafaati and A. Khoddam, Validated HPLC
method for determination of amlodipine in human plasma and its application
to pharmacokinetic studies, IlFarmaco. 60 (2014) 789-792
[15]V. Dongre, S. Shah, P. Karmuse, M. Phadke, V. Jadav, Simultaneous
determination of metoprolol succinate and amlodipine besylate in
pharmaceutical dosage form by HPLC, J. Pharm. Biomed. Anal. 46
(2008) 583-586
[16]R. Naidu, U. Kale, M. Shingare, Stability indicating RP-HPLC method for
simultaneous determination of amlodipine and benazepril hydrochloride from
their combination drug product, J. Pharm. Biomed. Anal. 39 (2005)
147-155
[17]Q. Wenyuan, Q. Zhao, J. Jiang, P Hu, Simultaneous determination of
olmesartan and amlodipine in human plasma and urine by ultra-performance
liquid chromatography tandem mass spectrometry, J. Chromatogr. B
938(2015) 27-34
[18]A. Argekar, S. Powar, Simultaneous determination of atenolol and
amlodipine in tablets by high performance thin layer chromatography, J Pharm. Biomed. Anal. 21 (2000) 1137-1142
[19]K. Pandya, M. Satia, T. Gandhi, I. Modi R. Modi, Detection and
determination of total amlodipine by high performance thin layer
chromatography: a useful technique for pharmacokinetic studies, J. Chromatogr. B, 667 (1995) 315-320
[20]J. Shah, J. Parekh, P. Shah, P. Shah, M. Sanyal, P. Shrivastav,
Application of an LC-MS/MS method for the analysis of amlodipine, valsartan
and hydrochlorthiazide in polypill for a bioequivalence study, J. Pharm. Anal. 7 (2017) 1-8